







New York, Sept. 24, 2026 — U.S. stocks ended Wednesday’s session firmly in the red. However, a surge in Treasury yields reached their highest levels in nearly two decades, overwhelming the Nasdaq rally.
Moreover, a stronger-than-expected reading on business activity revived fears that the Fed is not done raising rates. Additionally, investors weighed the outlook for rates against signs of slowing growth.
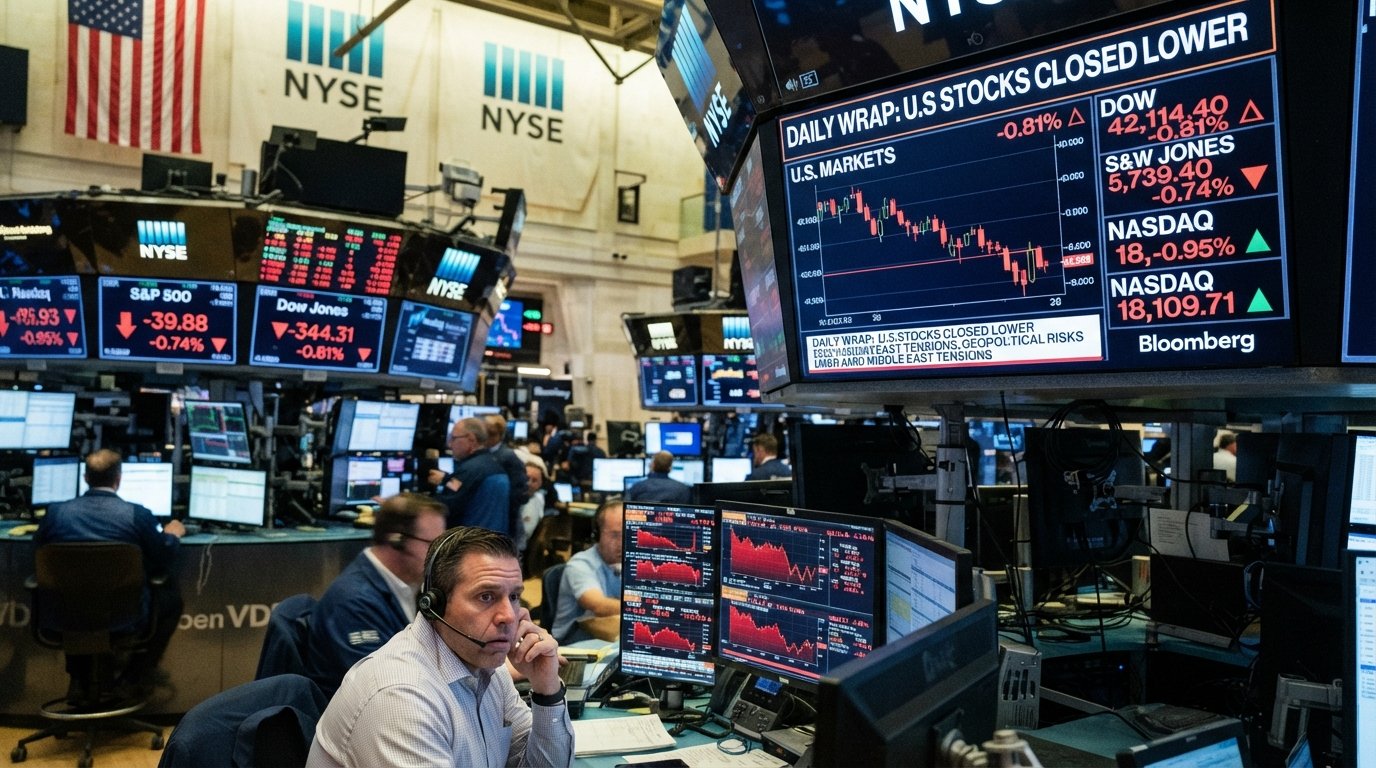
Brent crude briefly pushed above $100 a barrel amid renewed Middle East tensions. Daily Wrap: U.S Stocks Closed Lower Aimed Middle East Tensions offers context for the day’s moves.
According to Finviz’s market summary, “US stocks closed lower as strong business activity data drove the 10-year yield to a 19-year high and Brent crude moved above $100 amid renewed Middle East tensions ahead of Costco earnings and the Trump–Xi summit.” That one sentence captures the three forces investors are now juggling: interest rates, energy prices and geopolitics.
How the Major Indexes Finished
The Nasdaq Composite, the most rate-sensitive of the major benchmarks, fell about 1.1%, surrendering part of the gains that had lifted it to a record close of 27,244 on Tuesday. The S&P 500 lost roughly 0.7%, and the Dow Jones Industrial Average shed more than 300 points, or about 0.6%. Small caps suffered the most: the Russell 2000 dropped about 1.6%, reflecting the heavier debt loads and greater sensitivity to borrowing costs that characterize smaller companies.
The damage beneath the surface was far worse than the headline index moves suggested. Finviz breadth data show that only 1,349 stocks advanced (24.1%) while 4,050 declined (72.2%). Roughly three losers for every winner is the kind of lopsided session that typically signals broad de-risking rather than a rotation between sectors.
| Market Breadth (Finviz, Sept. 23 close) | Count | Share |
|---|---|---|
| Advancing stocks | 1,349 | 24.1% |
| Declining stocks | 4,050 | 72.2% |
| New 52-week highs | 77 | 19.6% |
| New 52-week lows | 316 | 80.4% |
| Above 50-day SMA | 1,817 | 32.5% |
| Above 200-day SMA | 2,386 | 42.6% |
The Trigger: A Hot PMI and a Bond Market Selloff
The selloff began with data. S&P Global’s flash PMIs for September came in far above forecasts. Manufacturing at 57 exceeded forecasts of 53.7. Services at 58.7 topped 55.8. The composite at 58.4 beat 55.3.
Business activity is now running at its strongest pace in more than five years. In a normal environment, that would be cheered as a sign of economic resilience.
However, inflation remains well above the Fed’s 2% target. It was read as a reason for the central bank to keep tightening. Daily Wrap: U.S Stocks Closed Lower Aimed Middle East Tensions noted the risk tone.
Bond traders moved quickly. The 10-year Treasury yield climbed to roughly 5.1%, its highest level since 2007. The 5-year note crossed 5% intraday for the first time since 2007, and the 30-year yield rose to around 5.4%. The 2-year yield, the most sensitive to near-term Fed expectations, jumped about 14 basis points to roughly 4.89%. Futures markets now assign well over even odds to another 25-basis-point hike at the Fed’s October meeting, with estimates ranging from about 60% to 71% depending on the source and time of day.
Fed Governor Michael Barr added fuel, saying “further policy adjustments are likely to be needed” to bring inflation back to target. That comment came just one week after the Federal Open Market Committee voted 12-0 on Sept. 16 to raise the federal funds rate by 25 basis points to a range of 3.75% to 4.00%, its first hike since 2023.
Sector Scorecard: Energy Stands Alone
Finviz sector data show Energy was the only one of 11 sectors to finish higher, gaining 0.84% as oil prices climbed. Every other sector declined:
- Basic Materials: −2.23%
- Utilities: −1.83%
- Communication Services: −1.82%
- Consumer Cyclical: −1.54%
- Real Estate: −1.50%
- Healthcare: −1.17%
- Financial: −0.92%
- Technology: −0.81%
- Industrials: −0.69%
- Consumer Defensive: −0.35%
The pattern is instructive. The sectors that behave most like bonds — utilities and real estate — fell sharply because their dividend yields look less attractive when a risk-free Treasury pays more than 5%. Basic Materials was dragged down by a collapse in precious metals, with Finviz showing the Silver industry down 7.24% and Gold miners down 4.09% as a stronger rate outlook weighed on non-yielding assets.
Mega-Cap Moves: Alphabet Slides, Meta and Palantir Rise
Among the most-watched names on Finviz, the day was mixed. Alphabet was the standout decliner, with Class A shares (GOOGL) down 3.80% and Class C shares (GOOG) down 3.58%. Amazon (AMZN) fell 2.24%, Nvidia (NVDA) 1.47%, Micron (MU) 2.22%, Oracle (ORCL) 3.11% and Shopify (SHOP) 3.66%. McDonald’s (MCD) was one of the worst large-cap performers, sliding 4.81%.
On the other side, Meta Platforms (META) gained 1.02% after CEO Mark Zuckerberg said the company’s new Muse AI agent — which reached the top of Apple’s App Store — will take “a small fee” on transactions it facilitates. Investors appear to be weighing Muse as a new revenue stream for Meta and a potential threat to businesses that rely on search, e-commerce and travel booking. Palantir (PLTR) rose 3.68%, Boeing (BA) gained 1.12% and Microsoft (MSFT) added 0.52%. Cybersecurity names were also among the day’s rare winners.
Commodities and Currencies
Brent crude traded above $100 during the session before settling near $99, while West Texas Intermediate held around $90. Oil had jumped almost 4% on renewed U.S.-Iran tensions before easing as President Trump described talks with Iran at the United Nations as “very good” and “very productive.” Gold fell to roughly $4,300 an ounce, and Bitcoin slipped about 2.3% to near $84,300. In currency markets, attention is turning to Japan, where the yen is approaching 160 per dollar — a level that has historically raised the risk of intervention by Tokyo.
Why This Matters for Investors
The central question for markets is no longer whether the Fed will cut rates but how many more times it will raise them. The September dot plot showed 16 of 19 FOMC participants expecting at least one more hike before year-end, and the Fed’s own projections do not see inflation returning to 2% until 2029. With 10-year yields above 5%, the valuation cushion for richly priced growth stocks is thinner. Finviz data show the Technology sector trading at a trailing P/E of 32.98 and a price-to-sales ratio of 8.28 — levels that leave little room for disappointment if rates keep rising.
At the same time, a Reuters report circulated on Finviz noted that fewer stocks are carrying the market than at any time since the dot-com peak. Narrow leadership can persist for long periods, but it also means index-level gains can be fragile when the few leaders stumble, as Alphabet did on Wednesday.
Key Takeaways
- Only 24.1% of stocks rose; 72.2% fell, with 316 new lows against just 77 new highs.
- The 10-year yield near 5.1% is the highest since 2007; the 5-year briefly topped 5%.
- Energy (+0.84%) was the only sector to finish higher on Finviz.
- Markets price roughly 60%–71% odds of another Fed hike in October.
- Alphabet fell 3.80% while Meta rose 1.02% on its Muse AI agent news.
What Comes Next
Thursday brings initial jobless claims (forecast 201,000), the second-quarter current account balance (forecast −$255 billion) and August new home sales (forecast 620,000 annualized). Darden Restaurants, TD SYNNEX and BlackBerry report before the open, with Costco and Scholastic after the close. Chinese President Xi Jinping’s state visit to Washington will keep trade policy in focus, after Treasury Secretary Scott Bessent said the U.S.-China trade truce has been extended for two months.
For investors, the playbook in a rising-yield environment usually favors quality balance sheets, companies with pricing power and sectors that benefit directly from higher commodity prices. For policymakers, the message from markets is that a resilient economy and sticky inflation are forcing a longer and tighter monetary path than many expected at the start of the year.
Data source: Finviz market summary, breadth, sector and quote data as of the Sept. 23, 2026 close. Index, yield and commodity figures are supplemented by closing reports from TheStreet, Benzinga, Yahoo Finance and Charles Schwab. This article is for informational purposes only and is not investment advice.