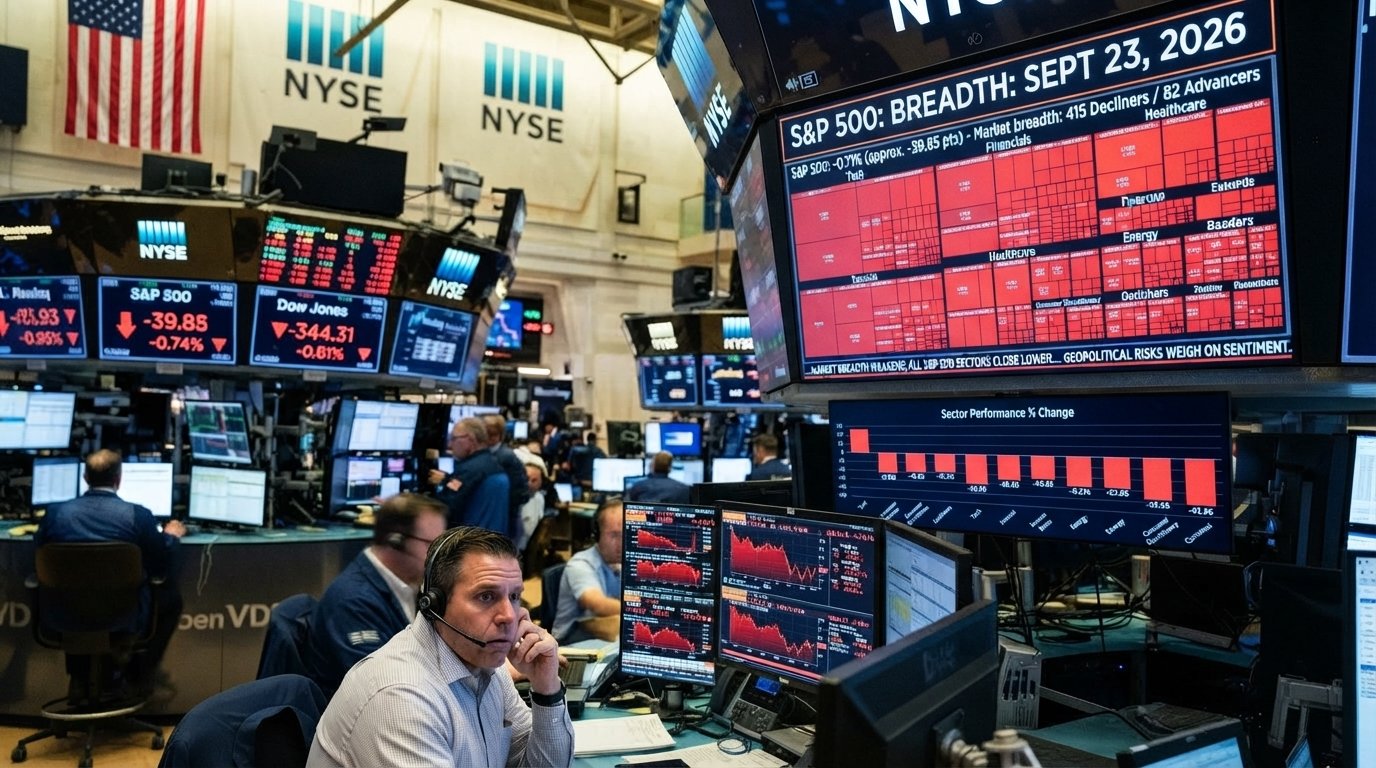














With a little more than three months left in 2026, the stock market’s sector leadership has become unusually clear — and unusually concentrated. Using Finviz’s sector performance and valuation data as of the close on Wednesday, Sept. 23, we built a complete scorecard to help investors, market watchers and analysts see where momentum is strengthening, where it is fading and how valuations line up against returns.
The Full Performance Table
| Sector | Sept. 23 | Week | Month | Quarter | Half Year | 1 Year | YTD |
|---|---|---|---|---|---|---|---|
| Energy | +0.84% | −2.00% | −0.94% | +14.40% | +1.28% | +38.91% | +36.31% |
| Technology | −0.81% | +5.85% | +7.88% | +8.66% | +37.50% | +28.83% | +29.65% |
| Basic Materials | −2.23% | +0.55% | −7.36% | +5.16% | +7.53% | +23.41% | +14.06% |
| Industrials | −0.69% | +0.83% | −2.64% | −7.08% | +2.26% | +10.75% | +8.88% |
| Healthcare | −1.17% | +0.49% | −3.98% | +6.98% | +14.78% | +20.31% | +7.62% |
| Consumer Defensive | −0.35% | −0.12% | −3.47% | −2.72% | +0.56% | +5.30% | +5.34% |
| Real Estate | −1.50% | −1.32% | −7.37% | −5.79% | +3.78% | −0.36% | +3.37% |
| Financial | −0.92% | −1.84% | −4.62% | +1.99% | +13.25% | +6.04% | +3.30% |
| Communication Services | −1.82% | +0.13% | +1.95% | +3.61% | +8.91% | +3.29% | +1.00% |
| Utilities | −1.83% | −2.64% | −6.82% | −12.23% | −11.31% | −5.85% | −6.69% |
| Consumer Cyclical | −1.54% | +0.96% | −5.56% | −1.36% | +2.25% | −9.62% | −7.76% |
Sorted by year-to-date performance. Source: Finviz.
The Leaders
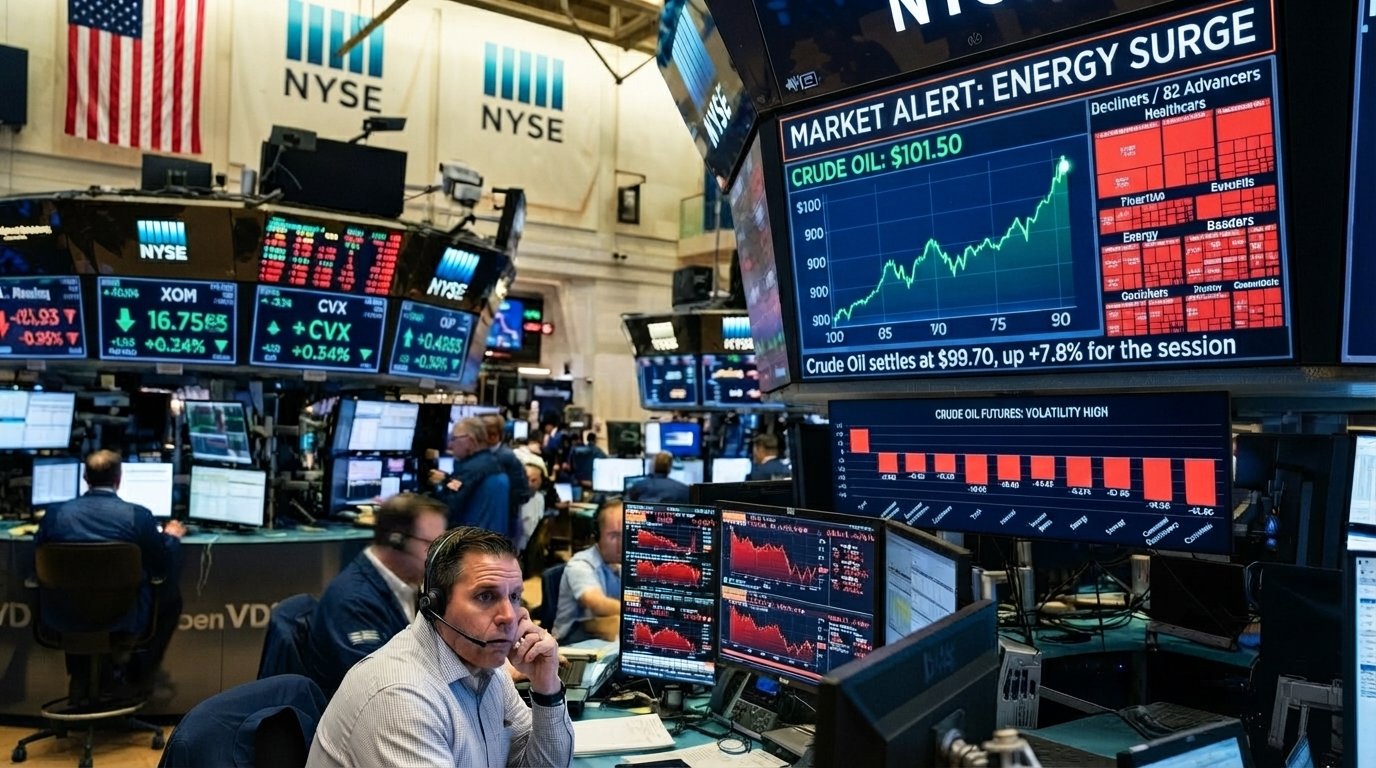
Energy (+36.31% YTD) is the best-performing sector of 2026 and the only one to rise on Wednesday. Its 14.40% gain over the past quarter tops all sectors. However, Energy’s shorter-term momentum has cooled: it is down 2.00% over the week and 0.94% over the month. The sector’s half-year return of just 1.28% indicates much of this year’s gain came early in 2026, followed by a pullback and a renewed rally over the summer as geopolitical tensions lifted crude. Brent briefly traded above $100 on Wednesday.
Technology (+29.65% YTD) has the strongest recent momentum of any sector by far. It is up 5.85% in the past week, 7.88% in the past month and an extraordinary 37.50% over six months. No other sector comes close on those timeframes. That momentum carried the Nasdaq to record closes on Sept. 21 and 22 before Wednesday’s rate-driven pullback.
Basic Materials (+14.06% YTD) is third but losing ground quickly. The sector fell 7.36% over the past month and 2.23% on Wednesday alone as precious metals sold off sharply.
The Laggards
Consumer Cyclical (−7.76% YTD) is the worst-performing sector of the year and down 9.62% over 12 months. The sector includes retailers, restaurants, automakers, homebuilders and travel companies — businesses that depend on discretionary spending and, in many cases, consumer credit. Higher interest rates, elevated fuel costs and concerns about AI disruption to online retail and travel booking have all weighed on the group. Finviz shows McDonald’s (MCD) fell 4.81% and Amazon (AMZN) 2.24% on Wednesday.
Utilities (−6.69% YTD) has been the most consistent loser. It is negative on every timeframe Finviz tracks — week, month, quarter, half year, year and YTD — and has fallen 12.23% over the past quarter. As a classic bond proxy, Utilities has been hit hard by the rise in Treasury yields to their highest since 2007.
Communication Services (+1.00% YTD) is essentially flat for the year despite holding some of the market’s largest companies. The sector fell 1.82% Wednesday as Alphabet dropped 3.80%.
Momentum Divergences Worth Watching
Comparing short- and long-term returns can reveal turning points:
- Healthcare is up 14.78% over six months and 20.31% over a year, but down 3.98% over the past month. That suggests a pause in what had been a strong recovery.
- Financials gained 13.25% over six months but have lost 4.62% in the past month and 1.84% in the past week. Rising yields help some financial businesses but hurt others, particularly mortgage-related lenders.
- Industrials are down 7.08% over the quarter despite the strongest PMI reading in more than five years, perhaps reflecting concerns about financing costs for capital projects and the sector’s high valuation.
- Consumer Cyclical rose 0.96% over the past week, one of its few positive readings, hinting at possible bargain-hunting after a long decline.
Valuations Versus Performance
| Sector | Market Cap | P/E | Fwd P/E | PEG | P/S | EPS Growth Next 5Y |
|---|---|---|---|---|---|---|
| Technology | $35.38T | 32.98 | 22.29 | 0.73 | 8.28 | 45.25% |
| Financial | $14.38T | 14.57 | 13.57 | 1.19 | 2.28 | 12.28% |
| Communication Services | $12.61T | 18.08 | 19.72 | 0.99 | 4.90 | 18.33% |
| Industrials | $9.44T | 36.72 | 27.84 | 1.82 | 3.12 | 20.21% |
| Healthcare | $9.18T | 31.97 | 18.27 | 2.17 | 1.97 | 14.76% |
| Consumer Cyclical | $8.78T | 23.80 | 19.65 | 1.18 | 1.78 | 20.17% |
| Energy | $4.82T | 13.89 | 12.27 | 0.90 | 1.33 | 15.48% |
| Consumer Defensive | $4.32T | 24.50 | 19.68 | 2.66 | 1.37 | 9.21% |
| Basic Materials | $2.90T | 20.70 | 14.59 | 1.18 | 2.30 | 17.51% |
| Real Estate | $1.72T | 31.50 | 27.83 | 2.84 | 4.17 | 11.10% |
| Utilities | $1.66T | 17.78 | 15.04 | 1.66 | 2.23 | 10.70% |
A few conclusions stand out. Energy combines the best year-to-date return with the lowest forward P/E (12.27), suggesting that the market remains skeptical that current profits will last. Industrials carry the highest trailing P/E (36.72) despite a negative quarterly return, which may leave the sector vulnerable if growth expectations disappoint. Technology’s size — at $35.38 trillion, more than the next two sectors combined — means its direction will largely determine the direction of the overall market for the rest of the year.
Industry-Level Extremes
Beneath the sector averages, Finviz’s 144 industries show even wider dispersion. At the top of the year-to-date leaderboard, Electronics & Computer Distribution has gained 92.87%, Oil & Gas Integrated 40.08%, Farm & Heavy Construction Machinery 37.58% and Oil & Gas E&P and Silver 28.79% each. At the bottom, Advertising Agencies are down 45.03%, Mortgage Finance 39.30%, Solar 24.06%, Building Materials 21.33% and Travel Services 18.75%.
These extremes tell a coherent story. The biggest winners are tied to AI infrastructure spending, energy scarcity and industrial activity. The biggest losers are either highly sensitive to interest rates (mortgage finance, building materials, solar, which relies heavily on project financing) or seen as vulnerable to disruption from AI agents (advertising agencies and online travel). That gap — close to 140 percentage points between the best and worst industries this year — is a reminder that stock selection within sectors can matter as much as sector allocation itself.
How Wednesday Fit the Pattern
Wednesday’s session, when the 10-year Treasury yield rose to roughly 5.1%, largely reinforced the year’s trends. Energy, the year’s leader, was the only sector to rise. Utilities and Real Estate, two of the most rate-sensitive laggards, fell 1.83% and 1.50%. The notable exception was Technology, the year’s momentum leader, which slipped 0.81% as higher yields pressured valuations. Basic Materials was the worst performer on the day at −2.23%, driven by a 7.24% drop in the Silver industry and a 4.09% drop in Gold miners.
What It Means for Different Readers
Investors should recognize that a market-cap-weighted index fund is now heavily tilted toward technology. Anyone seeking balance may need to deliberately add exposure to other sectors.
Market watchers should monitor whether Technology’s momentum can survive 5% Treasury yields and whether Consumer Cyclical’s recent weekly gain marks the start of a recovery or a pause in its decline.
Policymakers and economists can read the scorecard as a map of how the economy is responding to higher rates: sectors dependent on credit and consumer discretionary spending are lagging, while those tied to energy, AI investment and industrial activity are leading.
The final quarter of 2026 will test whether this leadership can hold — or whether rising rates finally force a broader rotation.
Data source: Finviz sector performance and valuation data as of the Sept. 23, 2026 close. This article is for informational purposes only and is not investment advice.