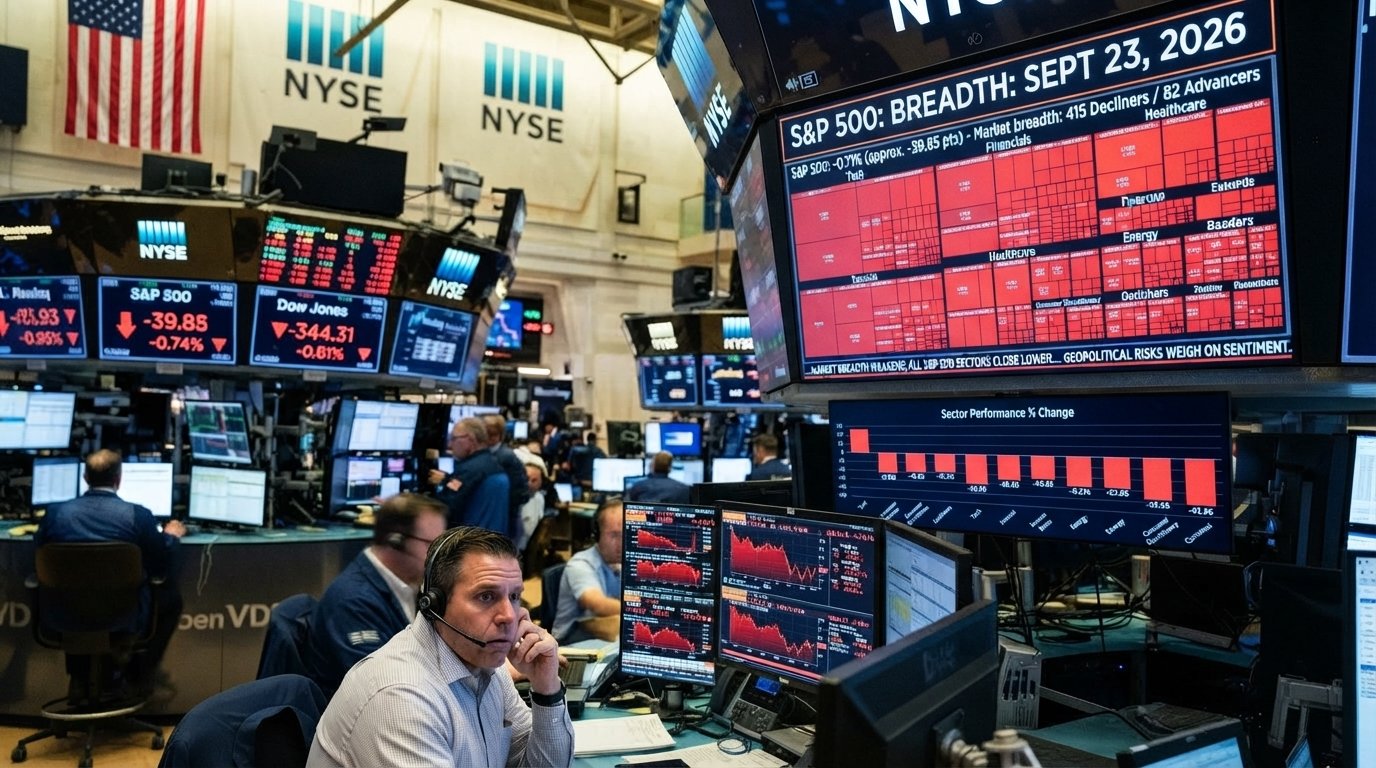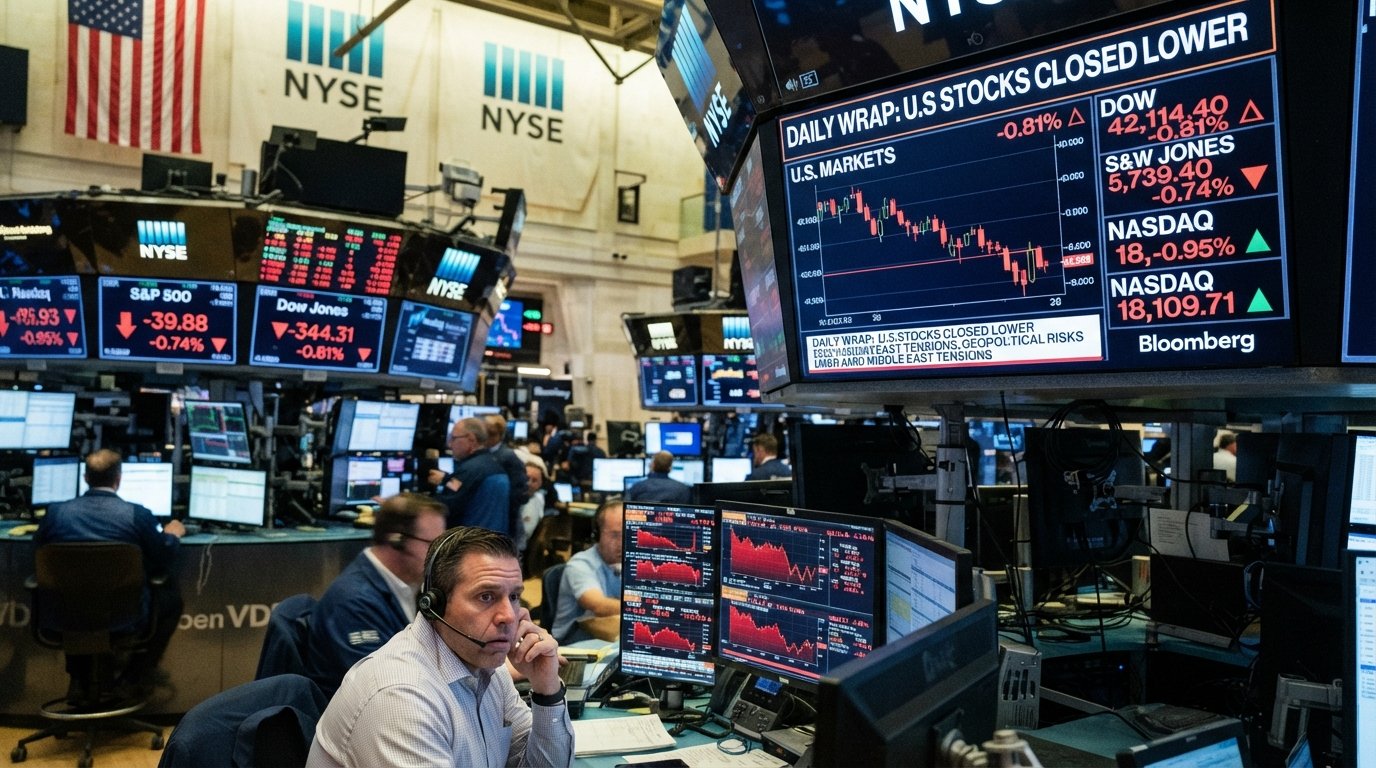











While the headlines on Wednesday, Sept. 23, 2026, focused on Treasury yields and the Federal Reserve, the most dramatic price moves of the day took place far from the mega-cap spotlight. Finviz’s signal tables show a handful of low-priced stocks that more than doubled — or lost most of their value — in a single session. These extreme moves offer important lessons for investors and market watchers about the risks and dynamics of the market’s most speculative corner.
Finviz Top Gainers
| Ticker | Last Price | Change | Volume |
|---|---|---|---|
| BENF | $2.90 | +438.73% | 295.02M |
| WHLR | $5.44 | +190.91% | 92.83M |
| VSA | $3.64 | +83.84% | 15.72M |
| ARTL | $7.31 | +76.14% | 25.13M |
| BFRG | $0.95 | +58.33% | 191.73M |
Finviz Top Losers
| Ticker | Last Price | Change | Volume |
|---|---|---|---|
| JAGX | $8.91 | −74.14% | 11.66M |
| HVII | $4.46 | −50.88% | 10.57M |
| IMCC | $2.91 | −29.71% | 29.56M |
| RPGL | $1.00 | −29.56% | 578.54K |
| HUBC | $3.21 | −24.29% | 435.49K |
Putting the Numbers in Perspective
BENF’s 438.73% gain means the stock closed at more than five times its prior-day price. Working backward from the $2.90 close, the stock started the day at roughly 54 cents. Even more remarkable was the volume: 295.02 million shares changed hands, making it one of the most actively traded stocks in the entire U.S. market on a day when many blue-chip names traded a fraction of that. At an average price in the dollar-plus range, that represents hundreds of millions of dollars in trading activity for a company that began the day worth very little per share.
WHLR’s 190.91% gain nearly tripled its share price to $5.44 on 92.83 million shares. Finviz also flagged both WHLR and ARTL for unusual volume, alongside LXEH and RKDA. RKDA traded 25.50 million shares while falling 4.91% to $0.43.
On the downside, JAGX’s 74.14% decline erased roughly three-quarters of the stock’s value in one session. Its $8.91 close implies a prior-day price near $34. HVII fell 50.88% to $4.46 and also appeared on Finviz’s new 52-week lows list.
Finviz’s signal tables report the price and volume data, not the reasons behind the moves. Investors should always check company filings and press releases before drawing conclusions about why a stock moved.
Common Drivers of Extreme Moves
Single-day moves of 50% or more in either direction typically stem from a limited set of catalysts. Understanding these helps investors assess risk, even without knowing the specific cause of a given move:
- Binary events: Clinical trial results, regulatory approvals or rejections, and court rulings can instantly change a small company’s prospects.
- Corporate actions: Mergers, buyouts, SPAC transactions and share-structure changes such as reverse stock splits can produce large price adjustments.
- Financing: Announcements of stock offerings often cause sharp declines because they dilute existing shareholders; small companies needing cash in a high-rate environment frequently resort to equity raises.
- Short squeezes and momentum trading: Heavily shorted, low-float stocks can surge as short sellers rush to cover, amplified by social media attention.
- Delisting or compliance issues: Stocks trading near or below $1 face exchange listing requirements, which can drive volatility.
New Lows and Oversold Signals
Finviz’s new-low list offered further evidence of stress among smaller companies. ADGM fell 53.04% to $0.23 and DCX dropped 29.69% to $0.07, while RPGL (−29.56% to $1.00) and HVII also hit new lows. In total, 316 stocks made new 52-week lows on Wednesday versus just 77 new highs.
Finviz flagged ADBT ($0.12, −3.85%) and NWCL ($7.83, −3.87%) as technically oversold, and TJGC and CBAT as overbought. TJGC rose 37.75% to $23.28 and CBAT gained 13.18% to $1.46, both reaching new highs.
Why This Matters in a High-Rate Environment
Wednesday’s session showed that smaller companies are especially vulnerable to rising interest rates. Finviz shows micro caps fell 2.04% and small caps 2.33% on the day, far more than large caps. Micro caps are down 0.88% year to date and 5.94% over 12 months.
Yet nano caps — the smallest companies of all — are up 35.07% year to date, according to Finviz. That seeming contradiction is explained by the kind of outsized moves seen in the table above. A few spectacular winners can pull up the average return of a group even when the typical stock is struggling. For an individual investor, the chance of owning the one stock that rises 400% is small; the chance of owning one that loses half its value is considerably higher.
Lessons for Investors
- Position sizing is critical. Any stock capable of rising 400% in a day can also fall 75%. Speculative positions should be small enough that a total loss would not damage a portfolio.
- Volume is not validation. Heavy trading can reflect short-term speculation rather than long-term conviction.
- Read the filings. SEC filings — especially 8-Ks, S-1s and prospectus supplements — often reveal financing, dilution or corporate actions that explain sharp moves.
- Beware chasing. Stocks on the top-gainers list often give back part of their gains in following sessions, particularly when the move was driven by momentum rather than fundamentals.
- Liquidity cuts both ways. Stocks like RPGL and HUBC traded fewer than 600,000 shares; thin trading can make it difficult to exit a position at a fair price.
The Math of Big Gains and Big Losses
Extreme moves are asymmetric in a way that often surprises new investors. A stock that falls 74%, like JAGX did on Wednesday, would need to rise roughly 287% just to return to its prior price. A stock that falls 50%, like HVII, needs a 100% gain to break even. By contrast, a stock that rises 438% can give back more than 80% of its price and still be above where it started the day. This asymmetry is why risk management — limiting how much can be lost on any single position — matters far more than chasing the biggest possible gain.
For Market Watchers and Regulators
Extreme volatility in low-priced stocks is an ongoing concern for regulators, who monitor for manipulation, pump-and-dump schemes and inadequate disclosure. The combination of high retail participation, social media amplification and easy access to trading apps has made these episodes more frequent. For market-structure analysts, days like Wednesday — when a sub-$3 stock trades nearly 300 million shares — are a reminder that speculative activity can thrive even in a broadly risk-off market.
The market’s extremes may not move the major indexes, but they reveal a great deal about investor behavior. On Wednesday, even as institutional investors retreated from risk across the board, speculative traders were chasing triple-digit gains in the market’s smallest names.
Data source: Finviz signal tables (top gainers, top losers, new highs, new lows, unusual volume, overbought and oversold) and capitalization data as of the Sept. 23, 2026 close. This article is for informational purposes only and is not investment advice. NewsTodayDigest does not recommend buying or selling any security mentioned.