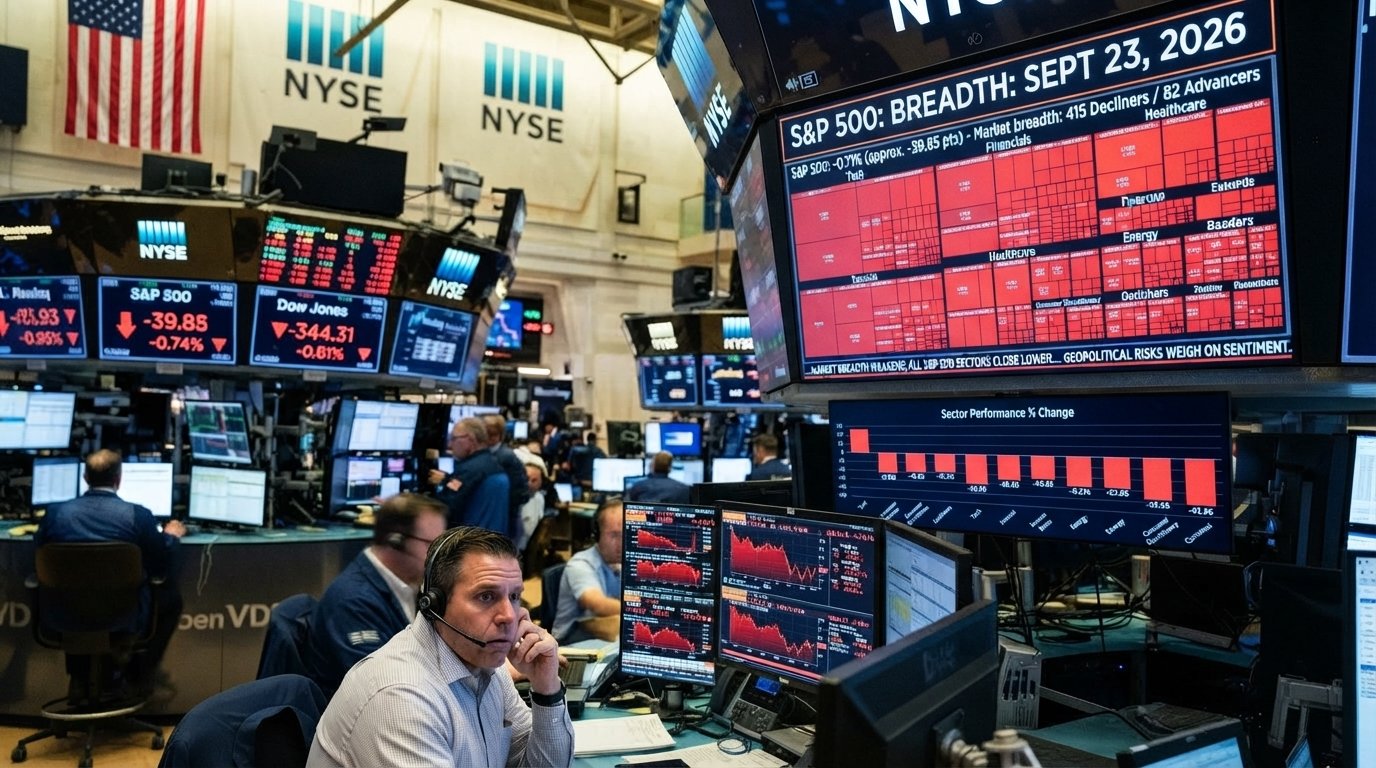












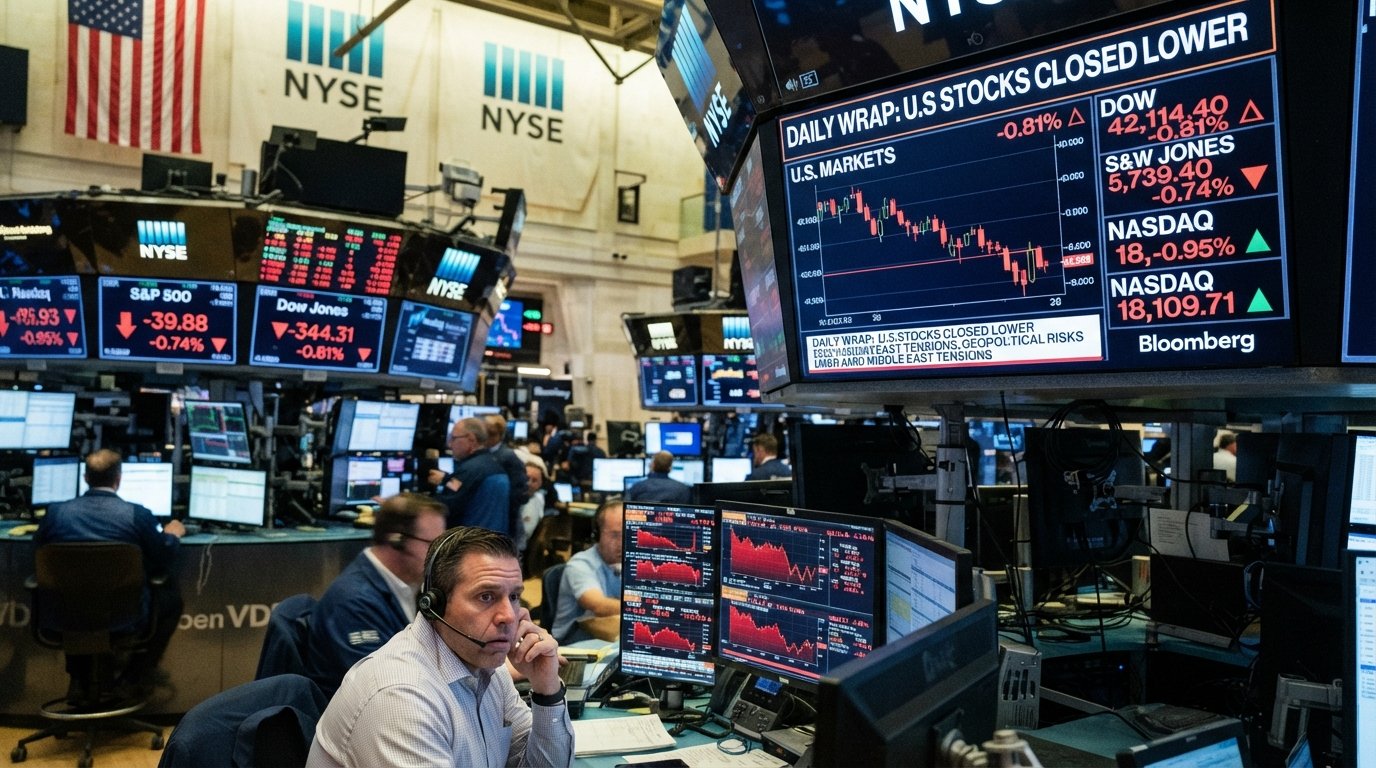
In most years, news that the U.S. economy is growing at its fastest pace in half a decade would be cause for celebration on Wall Street. On Wednesday, Sept. 23, 2026, it triggered a selloff. The reason lies in one of the central tensions of the current economic cycle: a strong economy means persistent inflation, and persistent inflation means higher interest rates.
The Data
S&P Global’s flash purchasing managers’ indexes for September, as reported by Yahoo Finance, showed a broad and powerful acceleration:
| Index | Actual | Consensus | Surprise |
|---|---|---|---|
| Manufacturing PMI | 57.0 | 53.7 | +3.3 points |
| Services PMI | 58.7 | 55.8 | +2.9 points |
| Composite PMI | 58.4 | 55.3 | +3.1 points |
A PMI reading above 50 indicates expansion; the further above 50, the faster the growth. Readings in the high 50s are rare and typically associated with booming conditions. Misses of three points relative to consensus are also unusual — PMI forecasts are generally accurate within a point or so. Wednesday’s data therefore represented a genuine shock to economists’ view of the economy.
Why Strong Growth Spooked Markets
The problem is the starting point. Inflation is already running well above the Federal Reserve’s 2% target. The Fed’s own September projections put 2026 headline PCE inflation at 3.7% and core at 3.4%, and officials do not expect inflation to return to 2% until 2029. The Fed raised rates by 25 basis points on Sept. 16 to a range of 3.75%–4.00%.
In that context, an economy running hot does three things that concern policymakers:
- It sustains demand-driven price pressure. Strong business activity means companies can pass on higher costs, and consumers keep spending.
- It tightens labor markets. Faster growth increases hiring and wage pressure, which feeds services inflation.
- It reduces the risk of overtightening. If the economy is booming, the Fed has more room to raise rates without triggering a recession — making further hikes more likely.
Markets responded exactly as that logic implies. The 10-year Treasury yield rose to roughly 5.1%, its highest since 2007. The 2-year yield jumped about 14 basis points to roughly 4.89%. October rate-hike odds climbed to between 60% and 71%, depending on the measure. And Finviz data show 72.2% of U.S. stocks declined on the day.
What the Equity Market Is Saying About the Economy
Interestingly, parts of the stock market have been signaling economic strength for months. Finviz industry data show several groups tied to physical economic activity posting big gains this year:
- Farm & Heavy Construction Machinery: +37.58% YTD
- Railroads: +20.98% YTD
- Chemicals: +18.68% YTD
- Industrial Distribution: +11.50% YTD
- Oil & Gas Integrated: +40.08% YTD
These are classic cyclical industries. Their outperformance, alongside Energy’s 36.31% year-to-date gain, is consistent with a strong nominal economy — growth plus inflation. By contrast, the industries hit hardest are those most sensitive to financing costs: Finviz shows Mortgage Finance down 39.30% YTD, Building Materials down 21.33% and Home Improvement Retail down 15.78%.
That split tells economists something important. The economy is not uniformly strong; it is strong where demand is driven by investment, energy and industrial activity, and weak where it depends on cheap credit.
The Growth Drivers
Several forces appear to be powering the acceleration. One is AI-related capital spending, which continues to drive demand for data centers, electrical equipment, cooling systems and semiconductors. Finviz’s Electronics & Computer Distribution industry is up 92.87% this year, a striking sign of the scale of infrastructure investment.
A second is foreign direct investment tied to trade agreements. Zero Hedge reported this week that South Korea selected a $22 billion Texas gas plant as its first down payment on a $350 billion investment pledge to the U.S. Commitments like these support construction and industrial activity.
A third is credit. One macro research firm featured on Finviz argued this week that “credit-fueled growth is moving the cycle forward.” Private credit markets have grown rapidly, and new financing structures — such as the hybrid CLOs blending private credit and leveraged loans that Blackstone is reportedly developing — continue to channel capital to businesses despite higher benchmark rates.
Separately, Capital Spectator reported that the U.S. economy picked up in the third quarter even as rising rates threaten momentum, consistent with the Fed’s upward revision of 2026 GDP growth to 2.3%.
A Global Contrast
The U.S. strength stands in contrast with signals elsewhere. Reuters reported that Japan’s factory activity growth slowed in September, and Bloomberg noted that Tokyo used-condo prices fell for the first time in more than two years. In Australia, unemployment climbed to 4.6% even as jobs increased. Meanwhile, Bloomberg reported that tumbling global government bond prices pushed aggregate yields toward 4% — suggesting that rising U.S. yields are exerting pressure on borrowing costs worldwide, whether or not other economies are growing as quickly.
This divergence matters for the dollar and for capital flows. Higher U.S. yields attract foreign capital, supporting the dollar. Bloomberg reported that the yen is approaching 160 per dollar, a level that has previously prompted intervention by Japanese authorities.
Questions Economists Are Asking
- Is this a sustainable boom or an energy-driven price surge? PMI surveys measure activity, but they also capture input and output price pressures. With Brent crude near $100 and diesel at record highs, some of the strength may reflect nominal rather than real growth.
- How will higher rates filter through? Monetary policy works with long lags. The full effect of the September hike and the climb in long-term yields will take many months to appear in the data.
- Is the labor market as tight as it looks? Initial jobless claims are expected at a low 201,000 on Thursday, but some analysts argue claims understate labor-market softening.
- What is the neutral rate? If the economy can grow this strongly with a fed funds rate near 4%, the neutral rate of interest may be higher than previously estimated — implying the Fed may need to hold rates higher for longer.
What to Watch
Thursday’s calendar includes initial jobless claims (forecast 201,000), the second-quarter current account balance (forecast −$255 billion) and August new home sales (forecast 620,000 annualized). Durable goods orders and consumer sentiment data are due later in the week. Each will be scrutinized for signs of whether September’s PMI strength is confirmed by hard data.
The Bottom Line
September’s PMI data paint a picture of an economy running well above its long-term trend. For workers and businesses, that is welcome news. For policymakers trying to bring inflation down, it complicates the task considerably. And for investors, it means the “good news is bad news” dynamic — where strong data lead to lower stock prices because of higher rate expectations — is likely to persist until inflation shows clear signs of retreating.
Data source: PMI data from Yahoo Finance; Finviz industry, sector and breadth data as of the Sept. 23, 2026 close; headlines via Finviz news and blogs feeds (Reuters, Bloomberg, Capital Spectator, Zero Hedge). This article is for informational purposes only and is not investment advice.