










One week after the Federal Reserve raised interest rates for the first time since 2023, financial markets are betting the central bank is only getting started. Strong economic data released Wednesday, Sept. 23, 2026, pushed Treasury yields to their highest levels since 2007 and sharply raised the odds of another hike at the Fed’s October meeting. For policymakers, investors and economists alike, the monetary policy outlook has shifted decisively.
What the Fed Did on Sept. 16
The Federal Open Market Committee voted 12-0 to raise the federal funds rate by 25 basis points to a target range of 3.75% to 4.00%. The unanimous vote was itself a signal: there was no dissent from officials favoring a pause.
Fed Chair Kevin Warsh was blunt at his press conference. “Inflation is too high and has been for too long,” he said, emphasizing that price stability is the central bank’s priority, according to Charles Schwab’s summary of the meeting.
The Fed’s quarterly Summary of Economic Projections reinforced the hawkish message:
| Projection | September 2026 SEP |
|---|---|
| 2026 real GDP growth | 2.3% (up from 2.2%) |
| 2026 headline PCE inflation | 3.7% |
| 2026 core PCE inflation | 3.4% |
| Unemployment rate, 2026 and 2027 | 4.1% |
| Return to 2% inflation | Not expected until 2029 |
The dot plot showed 16 of 19 FOMC participants expect at least one more rate hike before the end of 2026. However, only eight dots project another 25-basis-point increase in 2027, suggesting officials see the tightening cycle as measured rather than open-ended.
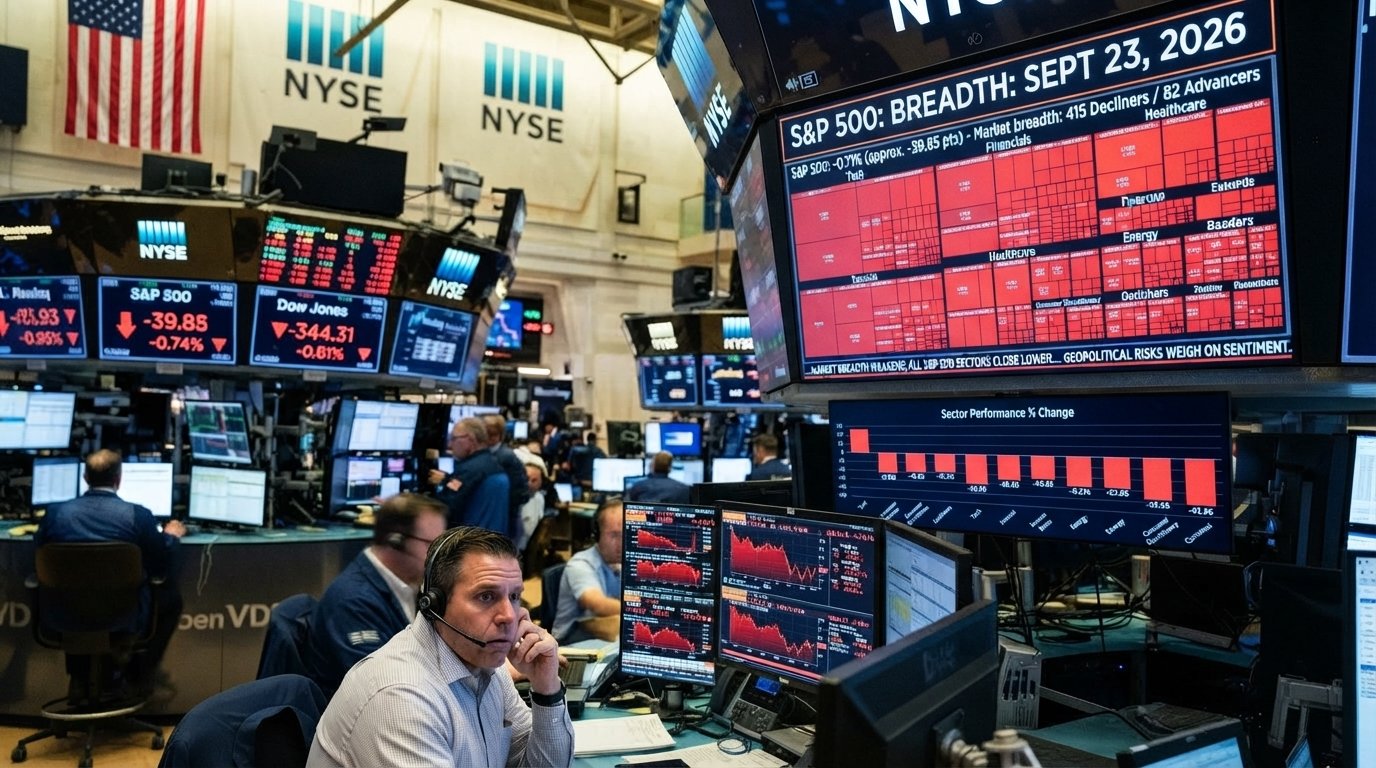
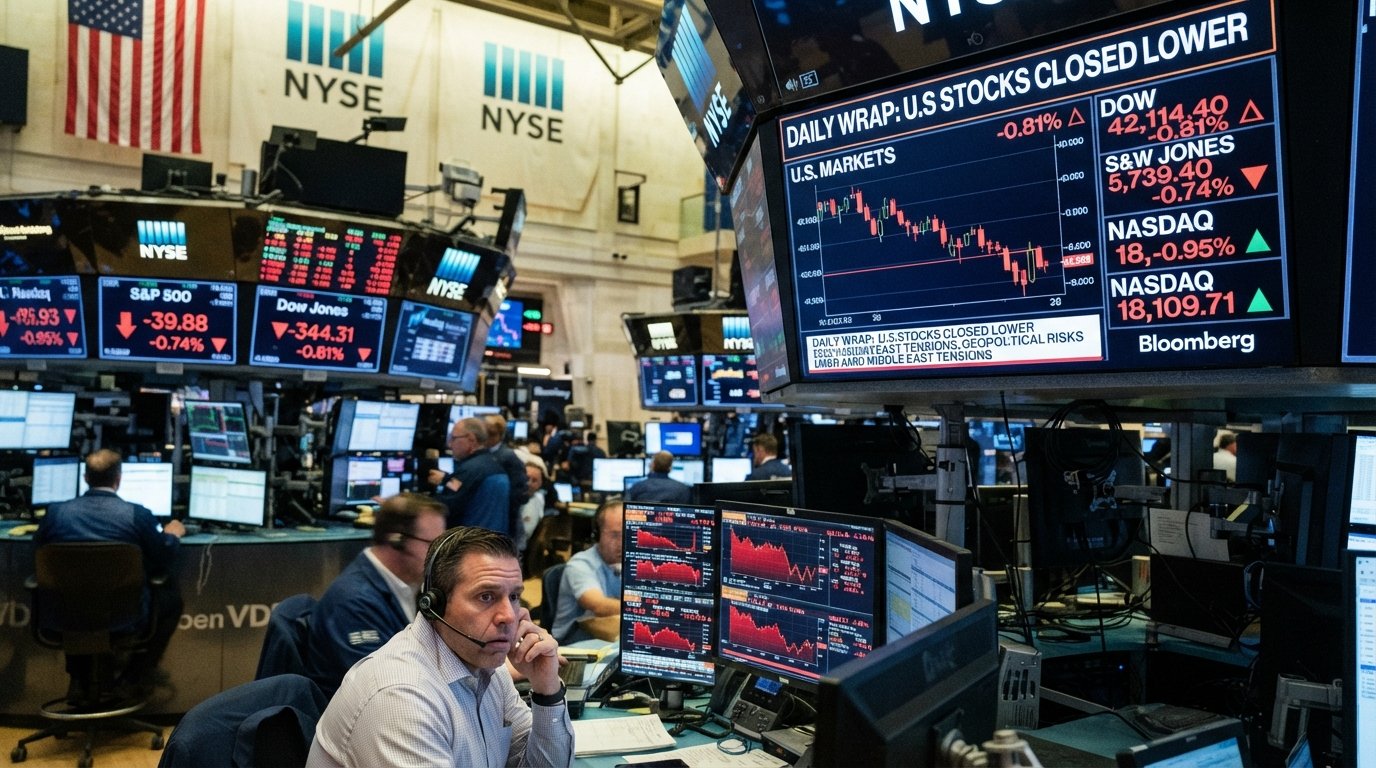
Markets reacted badly. Stocks initially rose after the decision but reversed during Warsh’s press conference, closing down roughly 1% as the S&P 500 hit a six-week low, and Treasury yields climbed back to 5%.
What Changed on Sept. 23
The catalyst for this week’s repricing was S&P Global’s flash PMI survey for September. Every reading beat expectations by a wide margin:
- Manufacturing PMI: 57.0 (expected 53.7)
- Services PMI: 58.7 (expected 55.8)
- Composite PMI: 58.4 (expected 55.3)
Business activity is now expanding at its fastest pace in more than five years. With inflation already well above target, an economy that is re-accelerating rather than slowing gives the Fed little reason to stop.
Fed Governor Michael Barr added to the hawkish tone Wednesday, saying “further policy adjustments are likely to be needed” to bring persistent inflation back to the 2% target.
Futures markets moved accordingly. According to Yahoo Finance, the CME FedWatch tool showed 71% odds of an October hike by the close, while Benzinga’s report cited roughly 60% odds of a 25-basis-point October hike and about 48% odds of another in December. The exact figures varied through the day, but the direction was clear.
The Bond Market’s Verdict
Treasury yields rose across the curve:
- 2-year: about 4.89% (+14 basis points)
- 5-year: crossed 5% intraday for the first time since 2007
- 10-year: roughly 5.1%, highest since 2007
- 30-year: roughly 5.4%
Notably, the 2-year yield rose more than the 10-year, a sign that the move was driven primarily by expectations for Fed policy in the near term. A Reuters analysis this week observed that “as 5% Treasury yields lose shock value, investors start worrying about 6%.” Mortgage rates followed, with the average 30-year fixed rate climbing above 7% to a two-year high.
The Treasury is also acting at the margins. Bloomberg reported that the U.S. plans to buy back up to $6 billion in longer-dated Treasuries, a liquidity-management operation that can help smooth market functioning but is small relative to the size of the market.
How the Stock Market Is Responding
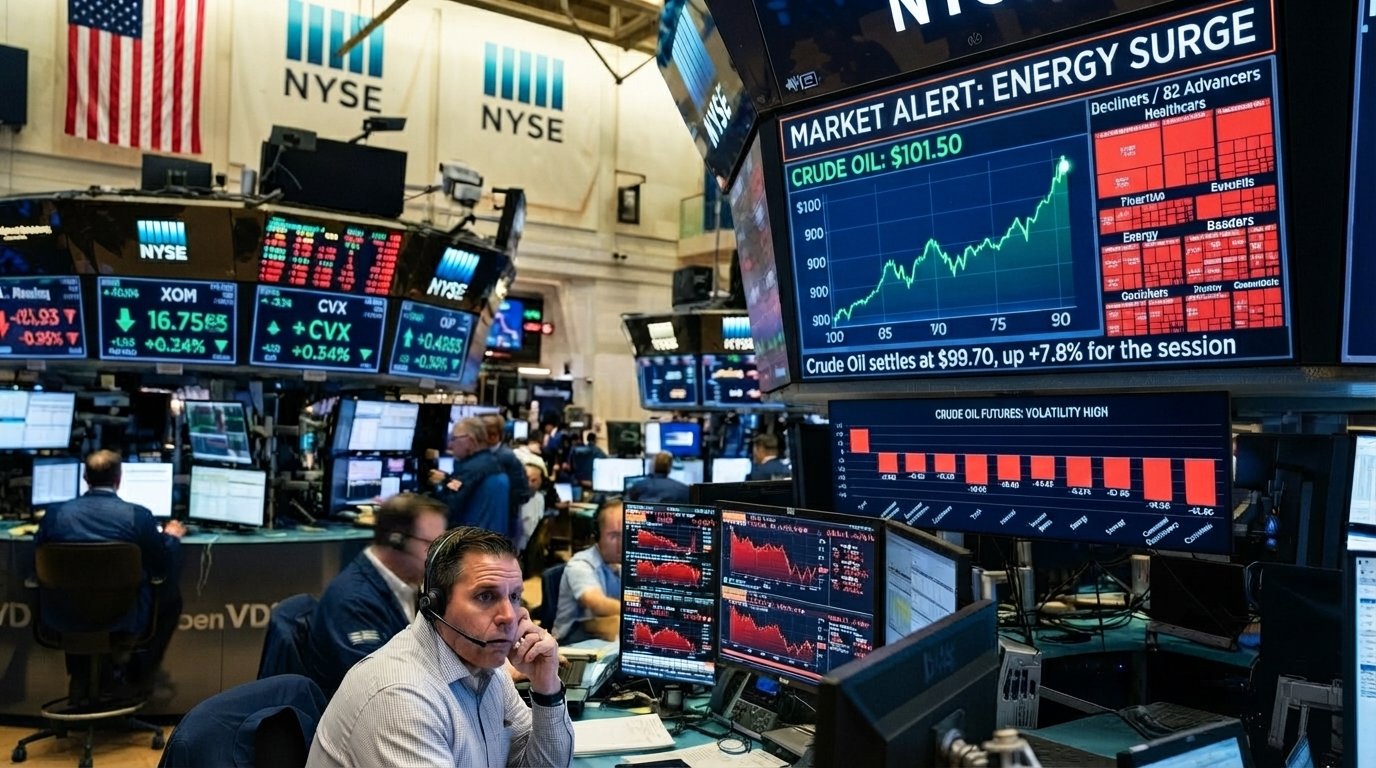
Finviz data from Wednesday’s session show the impact of the rate repricing: 72.2% of stocks declined, only 24.1% advanced and new 52-week lows outnumbered new highs 316 to 77. Rate-sensitive sectors took the brunt, with Utilities down 1.83% and Real Estate down 1.50%. Energy, up 0.84%, was the only sector to rise.
A Reuters report on Finviz noted that Fed rate hike cycles have a history of denting U.S. stock prices. That pattern is visible over the past month: Finviz shows Utilities down 6.82%, Real Estate down 7.37% and Financials down 4.62%.
The Political Dimension
The Fed’s tightening is unfolding against a charged political backdrop. With midterm elections approaching in November, higher borrowing costs for mortgages, car loans and credit cards carry obvious political consequences. A Reuters analysis this week noted that President Trump is essentially alone in calling for 1% interest rates — a position far removed from both the Fed’s projections and market pricing. The BBC also reported that the president disclosed millions of dollars in share transactions in big technology and AI companies.
For the Fed, maintaining credibility means demonstrating that policy decisions are driven by data rather than political pressure. The unanimous 12-0 vote in September suggests the committee is united on that front, at least for now.
Key Questions for Policymakers
- How much tightening is enough? With the fed funds rate at 3.75%–4.00% and core PCE inflation projected at 3.4%, the real policy rate is only modestly positive. Hawks argue it needs to rise further to be meaningfully restrictive.
- What role do energy prices play? Brent crude near $100 is pushing headline inflation higher. Monetary policy cannot produce more oil, and some analysts argue that the path to lower inflation runs more through geopolitics — including U.S.-Iran talks — than through rate hikes.
- Are financial conditions doing the Fed’s work? The climb in long-term yields, the rise in mortgage rates above 7% and falling stock prices all tighten conditions without additional Fed action. Some officials may argue this reduces the need for further hikes.
- What about downside risks? One commentary on Finviz this week argued that “the FOMC sees zero downside economic risks” — a warning that the Fed could be underestimating the possibility of a sharper slowdown once higher rates filter through.
What to Watch Next
The next major data points before the Fed’s October decision include weekly jobless claims (due Thursday, with forecasts of 201,000), August new home sales (forecast 620,000 annualized), the PCE inflation report and the September jobs report. Low jobless claims have been a sign of a tight labor market, although one analysis this week described them as “half a misnomer,” arguing that other labor indicators show more softening than claims alone suggest.
For investors, the practical takeaway is that the era of anticipating rate cuts is over, at least for now. Portfolios positioned for falling rates — long-duration bonds, unprofitable growth stocks, highly leveraged companies — face continued pressure. Assets that benefit from higher rates and stronger nominal growth, such as insurers, energy producers and short-term Treasury bills, have become more attractive by comparison.
The Fed has made its intentions clear. The market is now testing how far it is willing to go.
Data source: Finviz breadth, sector and news data as of the Sept. 23, 2026 close. FOMC details from Charles Schwab; PMI and FedWatch data from Yahoo Finance; yield data from TheStreet and Benzinga. This article is for informational purposes only and is not investment advice.