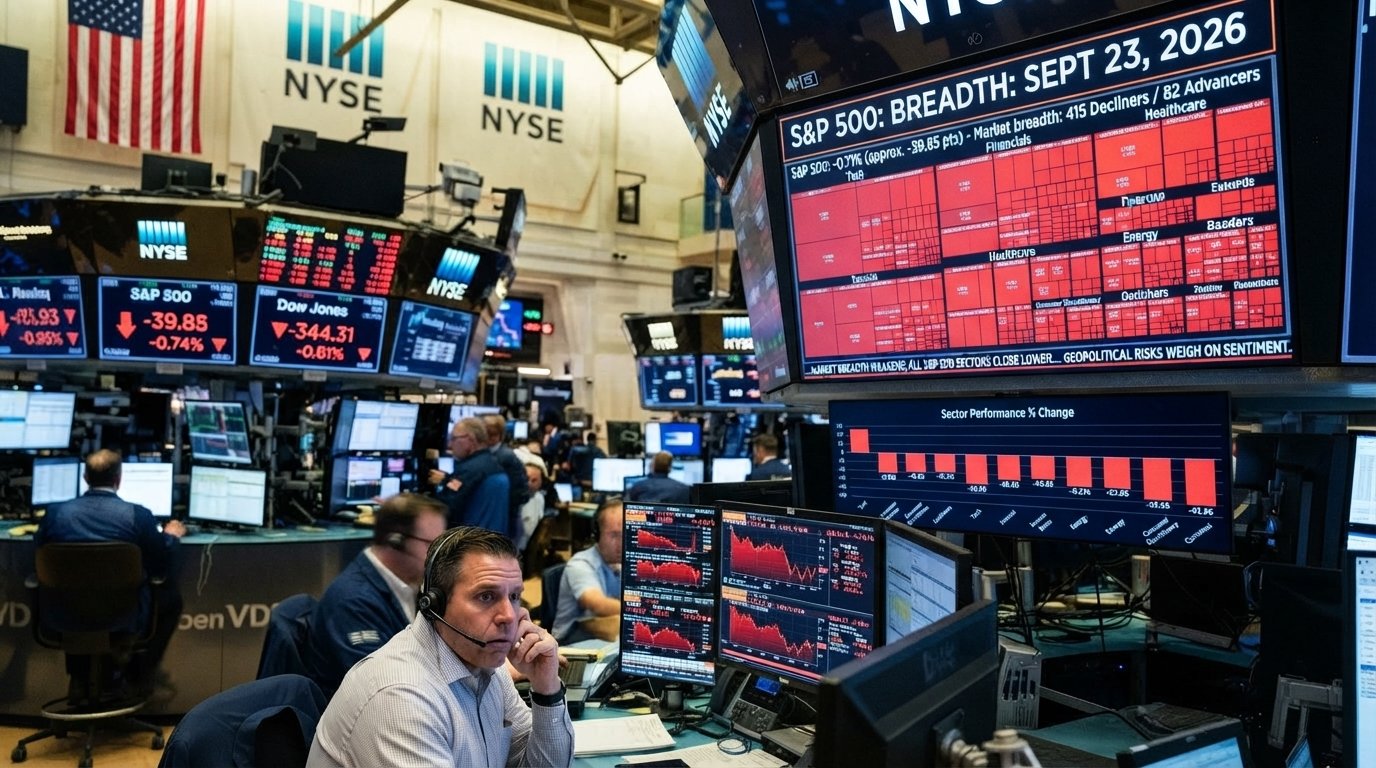















When interest rates rise, not all stocks feel it equally. Wednesday’s session made that painfully clear. As the 10-year Treasury yield climbed to roughly 5.1% — its highest level since 2007 — the Russell 2000 index of small-cap stocks fell about 1.6%, more than double the S&P 500’s decline of roughly 0.7%.
Finviz’s capitalization breakdown shows the gap even more starkly. Small-cap stocks fell 2.33% on average, while large caps slipped only 0.76%.
Performance by Market Capitalization
| Group | Today | Week | Month | Quarter | Half Year | YTD | 1 Year |
|---|---|---|---|---|---|---|---|
| Mega Cap | −1.06% | +2.21% | +2.64% | +7.05% | +18.42% | +10.38% | +13.00% |
| Large Cap | −0.76% | +1.68% | −1.63% | +0.99% | +14.05% | +15.21% | +16.41% |
| Mid Cap | −1.34% | −0.36% | −4.80% | −3.21% | +8.05% | +7.35% | +6.25% |
| Small Cap | −2.33% | −0.09% | −4.23% | −0.88% | +14.05% | +13.03% | +16.34% |
| Micro Cap | −2.04% | −0.02% | −6.27% | −5.05% | +1.29% | −0.88% | −5.94% |
| Nano Cap | −1.85% | +0.14% | −0.84% | +1.10% | +34.56% | +35.07% | +24.78% |
A few patterns jump out. Over the past month, every group below large cap is in negative territory, with micro caps down 6.27%, mid caps down 4.80% and small caps down 4.23%. Meanwhile, mega caps are up 2.64% for the month. The market’s biggest companies have continued to climb while the rest of the market has retreated — a textbook example of narrowing leadership.
Yet the year-to-date picture shows small caps have not been a disaster. At +13.03% YTD and +16.34% over 12 months, Finviz’s small-cap group has actually performed roughly in line with large caps over longer periods. The recent weakness is concentrated in the past month, coinciding with the Federal Reserve’s Sept. 16 rate hike and the subsequent climb in yields.
Why Small Caps Are So Sensitive to Rates
There are several structural reasons smaller companies suffer more when borrowing costs rise:
- Floating-rate debt: Small companies are more likely to borrow through bank loans and leveraged loans with floating interest rates. When the Fed hikes, their interest expense rises almost immediately. Large companies, by contrast, often locked in low fixed rates by issuing long-term bonds years ago.
- Lower profitability: A larger share of small-cap companies are unprofitable or marginally profitable. They depend on external financing to fund growth, and that financing becomes more expensive and harder to obtain as rates rise.
- Domestic focus: Small caps generate most of their revenue in the U.S., making them more exposed to domestic credit conditions and consumer spending.
- Refinancing risk: Companies with debt maturing in the next year or two face refinancing at sharply higher rates than they originally paid.
The credit backdrop is showing some strain. The Wall Street Journal reported this week that Florida railroad Brightline plans an imminent Chapter 11 filing in New Jersey — a reminder that heavily indebted companies face real consequences when rates stay high. At the same time, Bloomberg reported that Blackstone is working on a hybrid collateralized loan obligation blending private credit and leveraged loans, illustrating how financing markets are adapting to demand for higher-yielding assets.
Mid Caps: Caught in Between
Mid caps fell 1.34% on Wednesday and have been the weakest performers of any group over the past quarter outside micro caps, down 3.21%. Mid-cap companies are often large enough to carry meaningful debt but not large enough to access the cheapest financing. They also tend to be heavily represented in cyclical industries such as regional banking, housing-related businesses and consumer discretionary — all sectors that are sensitive to rates.
The Nano-Cap Puzzle
One number stands out on the Finviz table: nano caps are up 35.07% year to date and 34.56% over six months. That performance is better than any other group, including mega caps. But investors should read it carefully. The nano-cap universe consists of the smallest listed companies, and its returns are frequently driven by extreme moves in a handful of highly speculative stocks. On Wednesday alone, Finviz’s top gainers list included BENF, which soared 438.73% on volume of 295.02 million shares, and WHLR, up 190.91%. Its top losers included JAGX, which plunged 74.14%. Such swings can dramatically skew average returns for tiny companies.
Technical Picture
Earlier in the week, one technical analysis blog on Finviz noted the Russell 2000 appeared to be “shaping a swing low” — a potential bottoming pattern. Wednesday’s 1.6% decline tested that thesis. More broadly, Finviz breadth data show that only 32.5% of all stocks trade above their 50-day moving averages and 42.6% above their 200-day averages. Because small caps make up the majority of listed stocks by count, those breadth readings are largely a reflection of small-cap weakness.
What Could Turn Small Caps Around
Historically, small caps have tended to outperform when the Fed is nearing the end of a tightening cycle and when economic growth is accelerating. The second condition appears to be in place: September’s flash composite PMI came in at 58.4 versus an expected 55.3, indicating the strongest business activity in more than five years. Strong growth supports small-company earnings.
The problem is the first condition. The Fed’s latest dot plot shows 16 of 19 officials expecting at least one more rate hike this year, and futures markets price roughly 60%–71% odds of a hike in October. Until markets gain confidence that rates have peaked, small caps may struggle to sustain rallies.
Industries Dragging Small Caps Lower
Many of Wednesday’s worst-performing industries on Finviz are populated largely by smaller companies. Mortgage Finance fell 4.32%, Solar 3.56%, Uranium 3.86%, Biotechnology 2.87% and Other Precious Metals & Mining 4.67%. Biotechnology is a particularly important small-cap group: many biotech companies have no revenue and rely entirely on equity and debt markets to fund research, making them highly sensitive to the cost of capital.
Guidance for Investors and Market Watchers
For investors, the key distinction is between quality and speculation within the small-cap universe. Profitable small companies with low debt and positive cash flow can weather a high-rate environment; heavily indebted or cash-burning companies are far more vulnerable. Small-cap index funds hold both, and the unprofitable portion can drag heavily on returns when credit tightens.
For market watchers, the Russell 2000’s relative performance versus the S&P 500 is one of the best real-time gauges of how markets view credit conditions. Sustained small-cap underperformance often precedes wider credit stress.
For policymakers, small businesses are major employers. If the cost of capital keeps rising, the effects on hiring and investment will show up first among smaller firms — something Fed officials will be watching closely in labor market data, beginning with Thursday’s weekly jobless claims.
Wednesday’s session served as a clear reminder: in a rising-rate environment, size matters.
Data source: Finviz capitalization group performance, signal and breadth data as of the Sept. 23, 2026 close. Russell 2000 and S&P 500 closing changes from TheStreet. This article is for informational purposes only and is not investment advice.